Building a Geospatial Epidemic Model to Inform the Opioid Crisis Response
The Challenge: Why Opioid Hotspots Matter
The opioid crisis in the United States requires targeted intervention, but public health measures often lack the granular data necessary to allocate resources effectively. My goal in this project was to leverage advanced spatiotemporal modeling to identify precise geographic hotspots and vulnerable demographic groups driving the epidemic in Ohio.
This project transformed raw public health data into actionable intelligence, showcasing expertise in advanced statistical programming and geospatial analysis.
🛠️ My Technical Role & Execution
My primary role was in conceiving the study design, conducting the statistical and spatial modeling analyses, and interpreting the results. The project required the execution of several complex models:
1. Geospatial Analysis and Modeling
Data Preparation: I geolocated 11,790 deaths caused by prescription opioid overdose from 2010–2017 to the zip code level. Population sizes were estimated using projections from U.S. Census Bureau data and aggregated by zip code.
Spatial Clustering: I implemented Spatial Scan Statistical analysis (SaTScan) to identify 12 significant geographical clusters (hotspots) where the burden was most concentrated.
Risk Estimation: I conducted spatial and spatiotemporal Relative Risk (RR) estimation at the zip code level using Bayesian models fit with Integrated Nested Laplace Approximation (INLA). The model utilized a zero-inflated Besag-York-Mollie (BYM) model to accommodate sparse data
2. Time-Series and Statistical Modeling
Temporal Analysis: I identified significant temporal trends using Bayesian Interrupted Time Series Analysis implemented in the Causallmpact R package.
Rate Quantification: I used Poisson regression analysis to quantify the annual percentage change in prescription opioid death rates for various race and gender groups.
💡 Key Results and Impact
The models delivered precise findings that highlight the need for targeted intervention strategies.
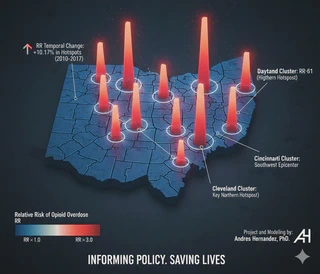
- Identified Hotspots: The analysis revealed that 40% of all deaths were concentrated in just 12 hotspots in Ohio, encompassing only 21% of the population. Most were located around the southwestern cities of Dayton, Cincinnati, and Columbus.
- Quantified Risk: The mortality rate within these hotspots was almost three times higher than in non-hotspot areas14. Cluster 1, around the city of Dayton, had the highest Relative Risk ($RR=3.61$) and the highest temporal increase in risk (+48.94%).
- Vulnerable Groups: We found that the burden was highest among white males aged 30–39 and, critically, showed a larger exponential increase among black males. The black male population experienced the fastest estimated annual increase in mortality rate (46.73%).
This work was published in the high-impact journal Scientific Reports, 2020 Scientific Reports as a guideline for designing and targeting public health interventions.